Better Without Boilers Campaign
Transitioning to a zero emissions future.
European climate foundation asked us to create an interactive site, to highlight the progress toward a zero emissions future. We worked with Good Praxis, who developed the site, using our designs.
We created a visual identity for the campaign, which focused on the phasing out of fossil fuel burners in favour of sustainable heating options. “Transition” was a key theme in the visual identity, and inspired components such as our colour scheme and use of gradients throughout the site. We also designed animated icons, to bring the site to life.
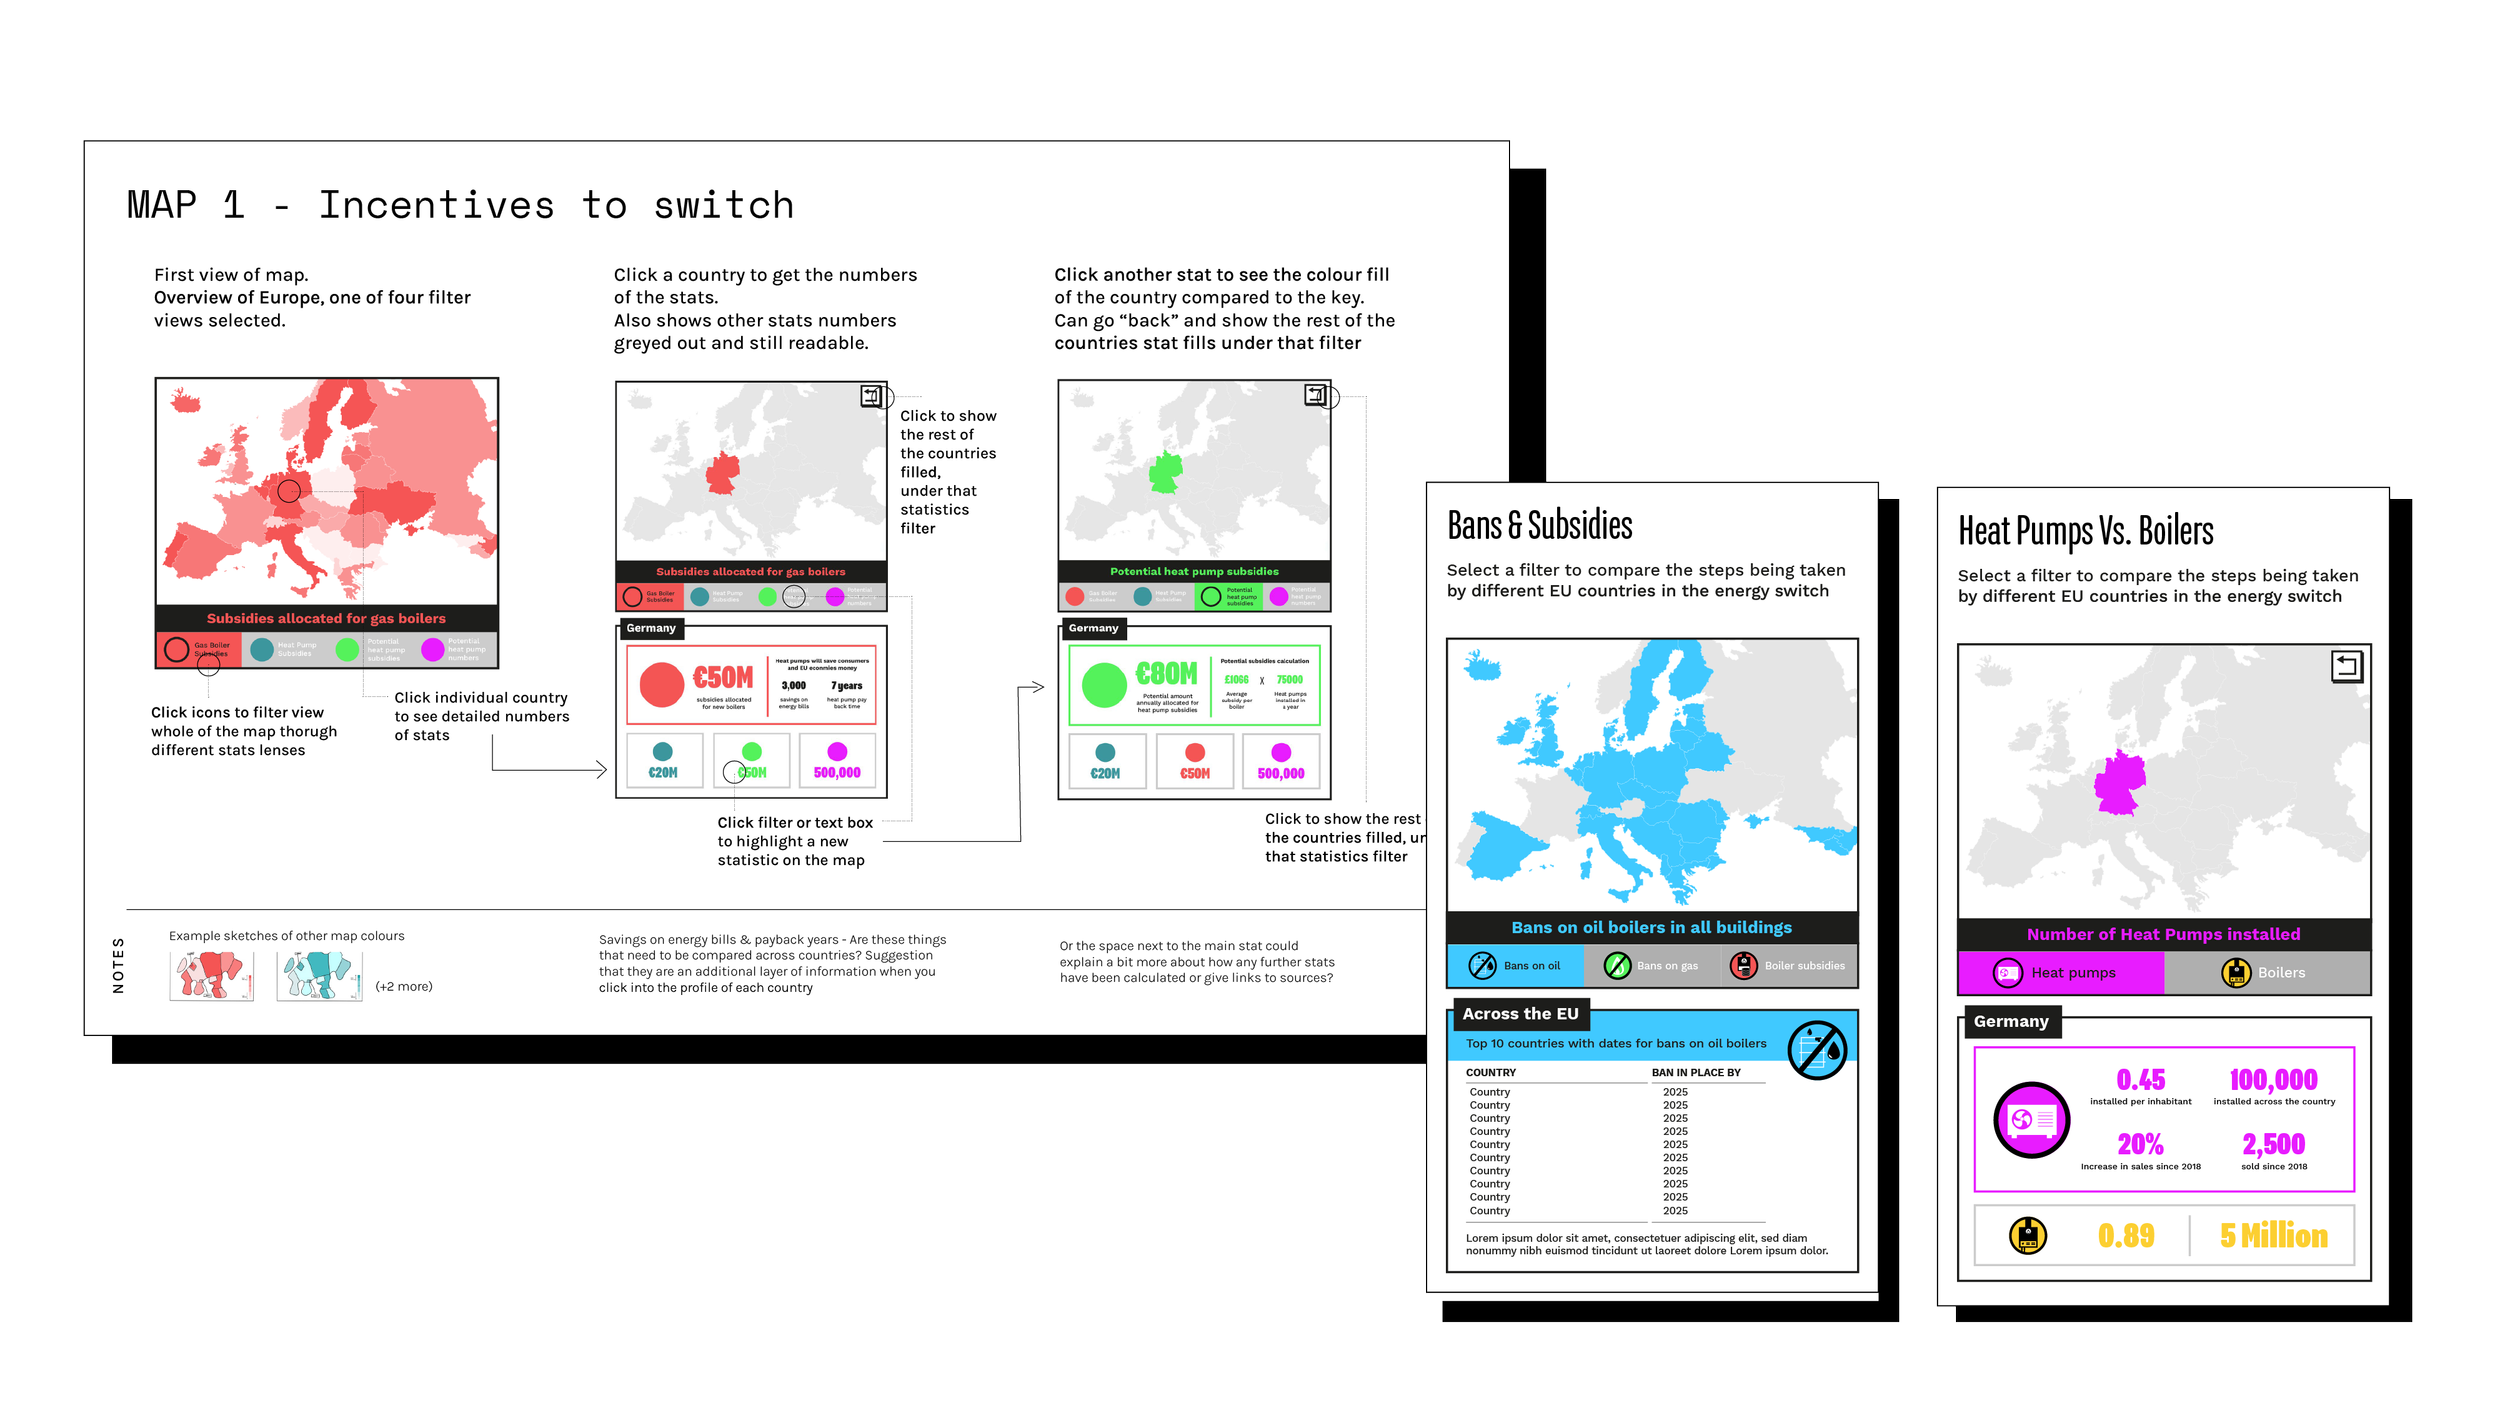
Considering the user journey of the site was at the forefront of our design process, as we had complex multilayerd datasets, with serveral variables. We opted to produce interactive maps where the viewer could click through different filters to uncover more information about bans, subsidies and heatpumps.


A key part of the website was developing a set of interactive features to highlight the key messages from the clients dataset and research.
In our first sketches for the graphics we started developing visuals around a map, with different filters for users to easily switch between and visually see the multiple different comparisons on various levels - EU wide, and country specific.
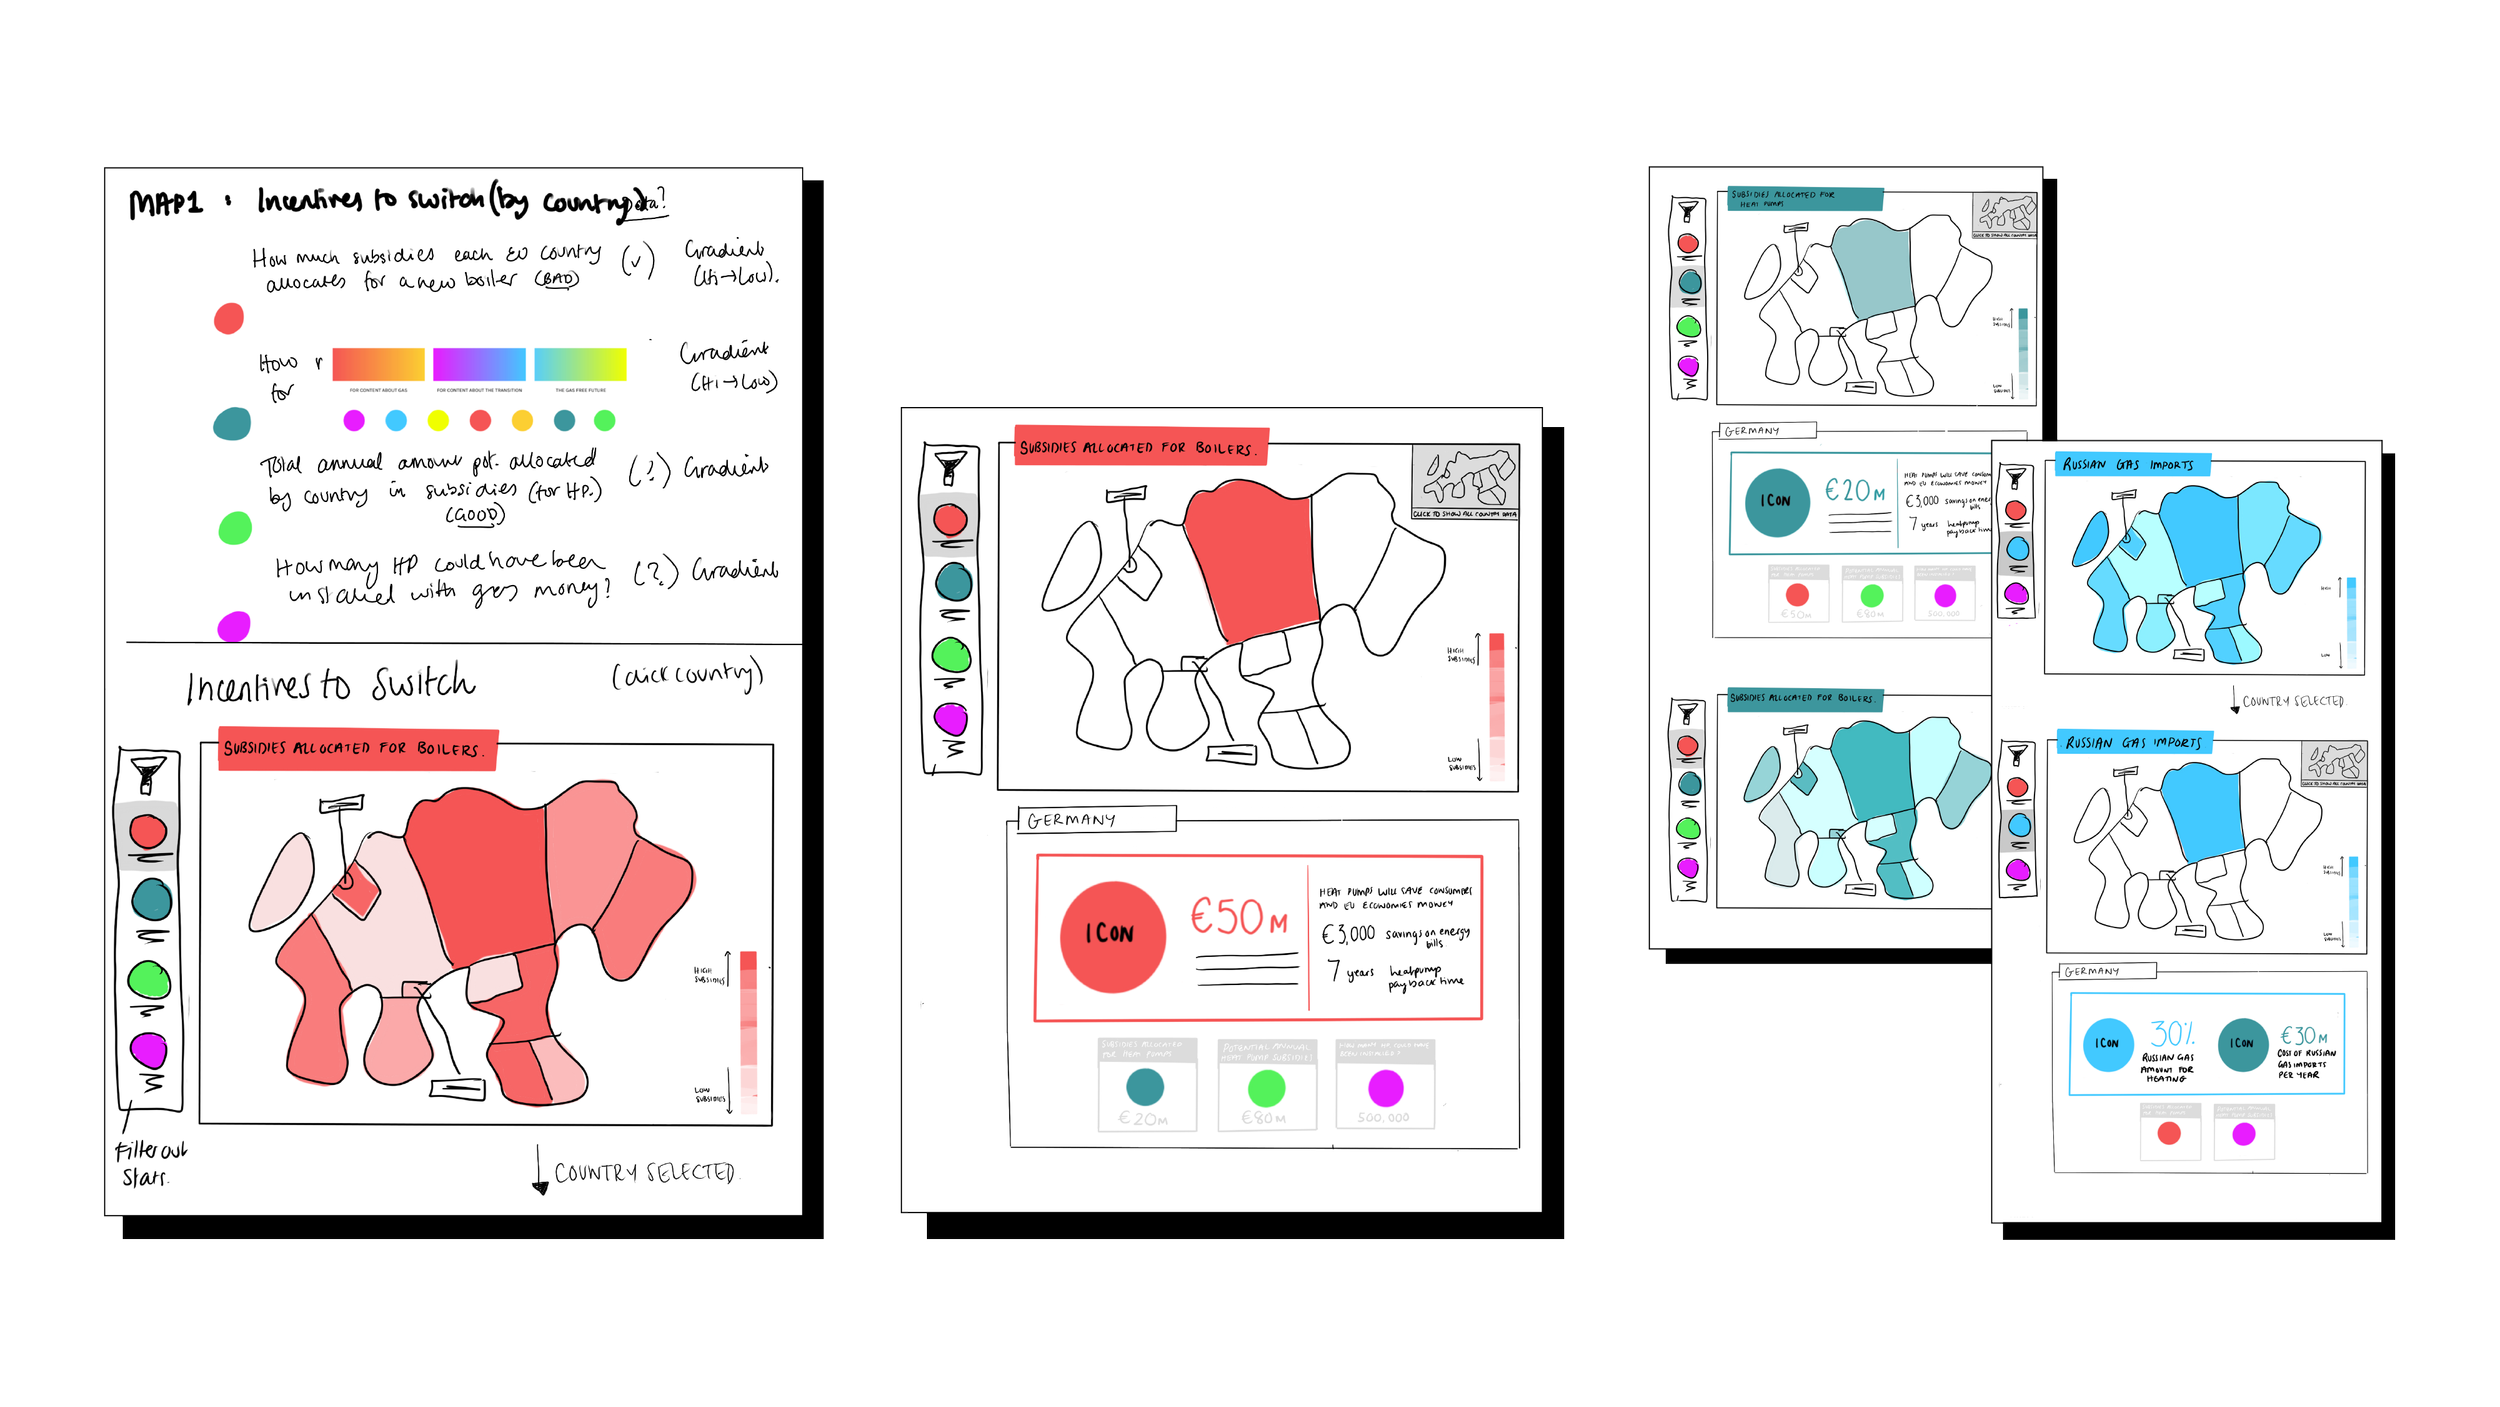


Developing the journey of the users interaction through wireframes helped to refine where key stats would appear and how users could interact with the map. Through this stage the data was developed with the client and the developer to ensure key messages were communicated.
The layout of the interactive elements were designed for mobile and then we worked with the developers to develop these for desktop as well. The Maps were developed alongside the overall campaign identity which included a logo, a set of icons, a live counter graphic, looping photo banner and site.